INPUT = network object
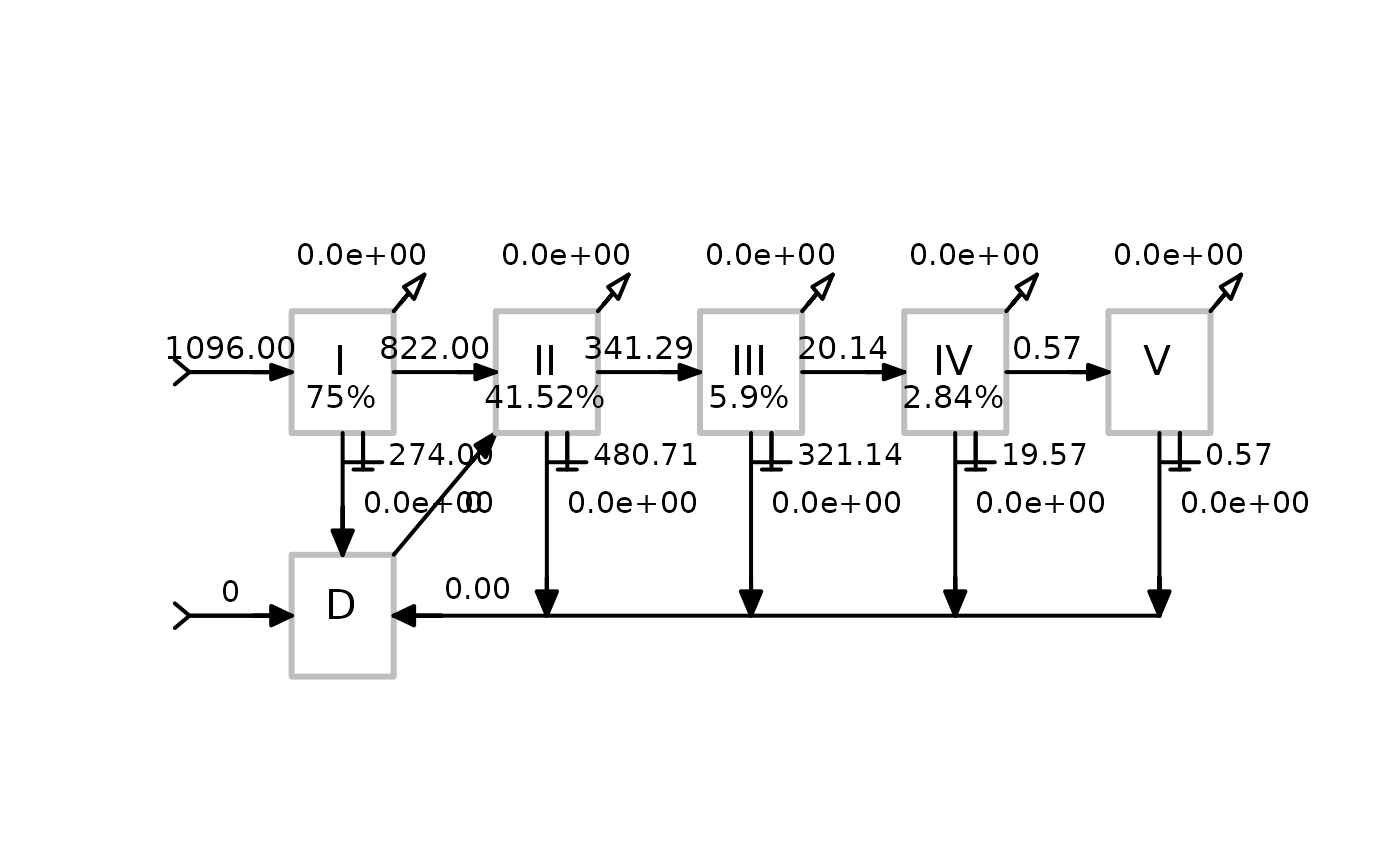
OUTPUT = plot of the lindeman spine
Dr. Ulrike Schückel, Landesbetrieb für Küstenschutz, Nationalpark
und Meeresschutz Schleswig-Holstein, Nationalparkverwaltung,
Schlossgarten 1, 25832 Tönning
Applies the enaTroAgg function and creates a plot of the Lindeman Spine
Usage
# S3 method for class 'lindeman'
plot(x = "model", enatroagg = "troagg", primprod = NULL, type = 1)
Arguments
- x
an ENA network object.
- enatroagg
the results of the enaTroAgg function applied to the model
- primprod
a vector of the nodes that are primary producers
- type
switches between two types of plots: 1 = I and D are separate, 2 = I and D are combined
References
Style of the plot according to Baird et al., 2004, 2007
Author
Ulrike Schuckel, Stuart R. Borrett
Examples
data(enaModels)
model <- enaModels[[8]]
enatroagg <- enaTroAgg(model)
#> [1] "Cycle free feeding transfers"
plot.lindeman(model,enatroagg, type = 1)