Calculates the flow throughout the entire network over a given path length.
Value
- thresholds
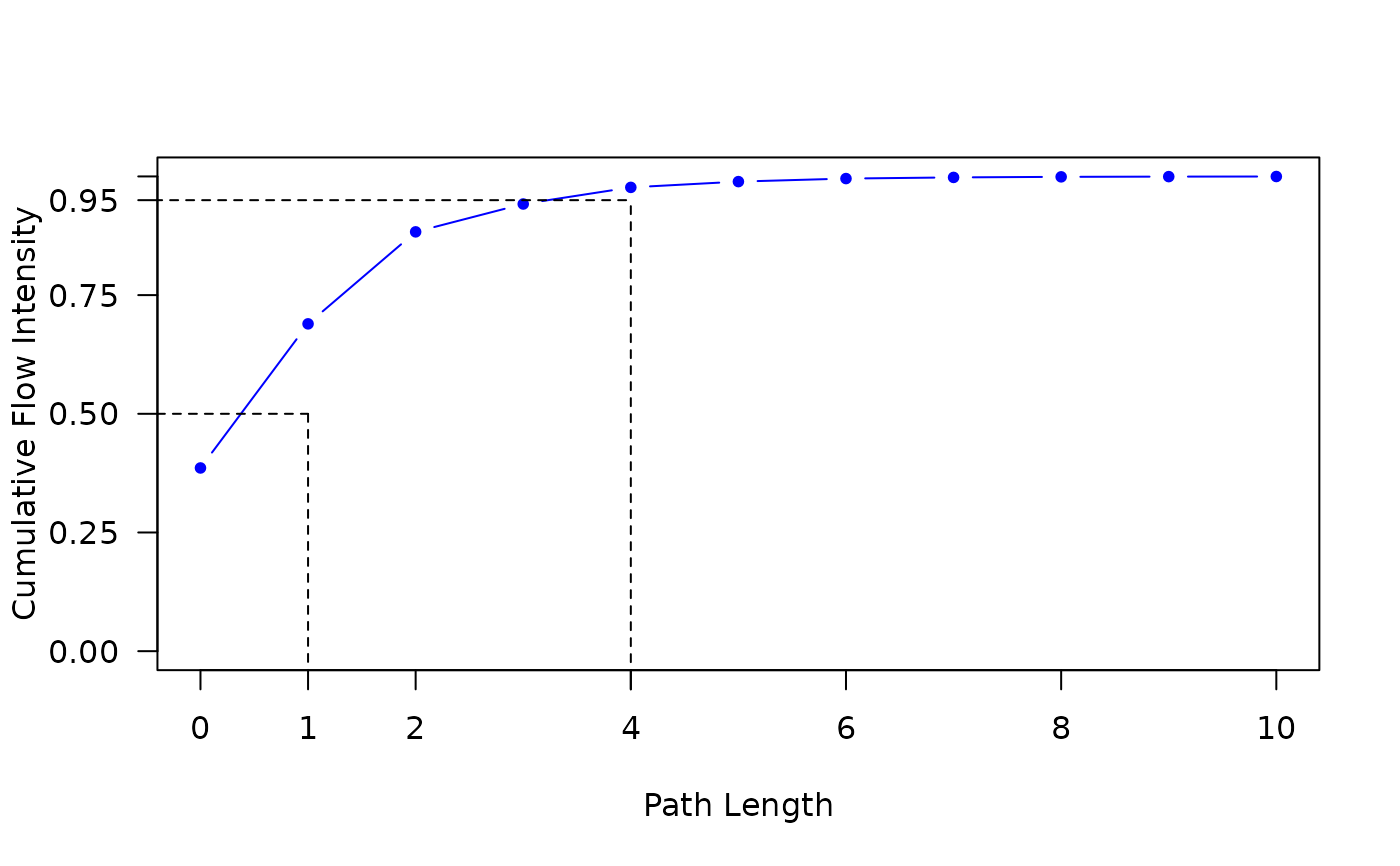
thresholds indicating the development of throughflow as path length increases: the path length at which indirect flow exceeds direct flow (mID), path length at which 50%, 90%, and 95% of total system throughflow is achieved (m50, m90, and m95, respectively)
- tf
total flow across paths from length 0 (Boundary inputs) to maxPath
- ctf
cumulative total flow from path length 0 to maxPath
References
Borrett, S.R, Patten, B.C., Whipple, S.J. 2010. Rapid development of indirect effects in ecological networks. Oikos 119:1136–1148.